Your Business Partner
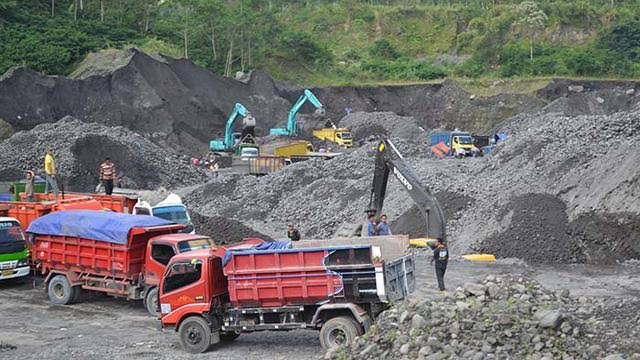
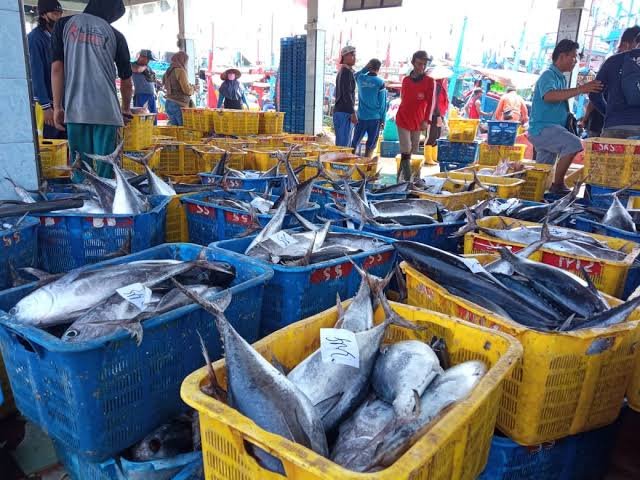
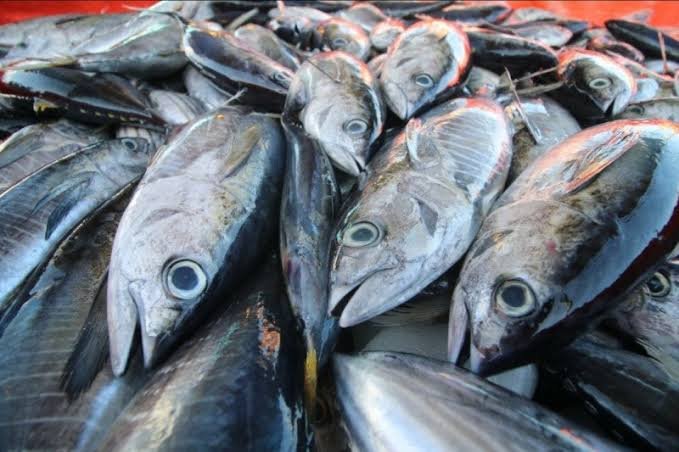
We provide comprehensive solutions in trade, fisheries, agriculture, mining, and construction, supporting your business with professional teams and investment opportunities.


Our Company
We provide comprehensive business solutions across various sectors including trade, fisheries, agriculture, mining, and construction.
Your trusted business partner.
Business Sectors
Diverse Industry Expertise
Professional Team
Established in 2023
Your trusted business partner.
Investment Opportunities
Join Us
Open for Investors
Collaborate with us to grow your business and explore new ventures.
Business Solutions
Explore our diverse sectors: trade, fisheries, agriculture, mining, construction, and services.